We took every regular-season game since 2005-06, the first season in which shootouts replaced ties, from the NHL's game results and recorded each team's record after its first 10 games, its final record and whether it reached the playoffs. The counts cover the 18 full 82-game seasons, 552 team-seasons. Three seasons are left out: the 2012-13 lockout cut the schedule to 48 games starting January 19, 2013; 2020-21 had 56 games starting January 13, 2021; and 2019-20 was paused in March 2020 and finished with 24 teams.
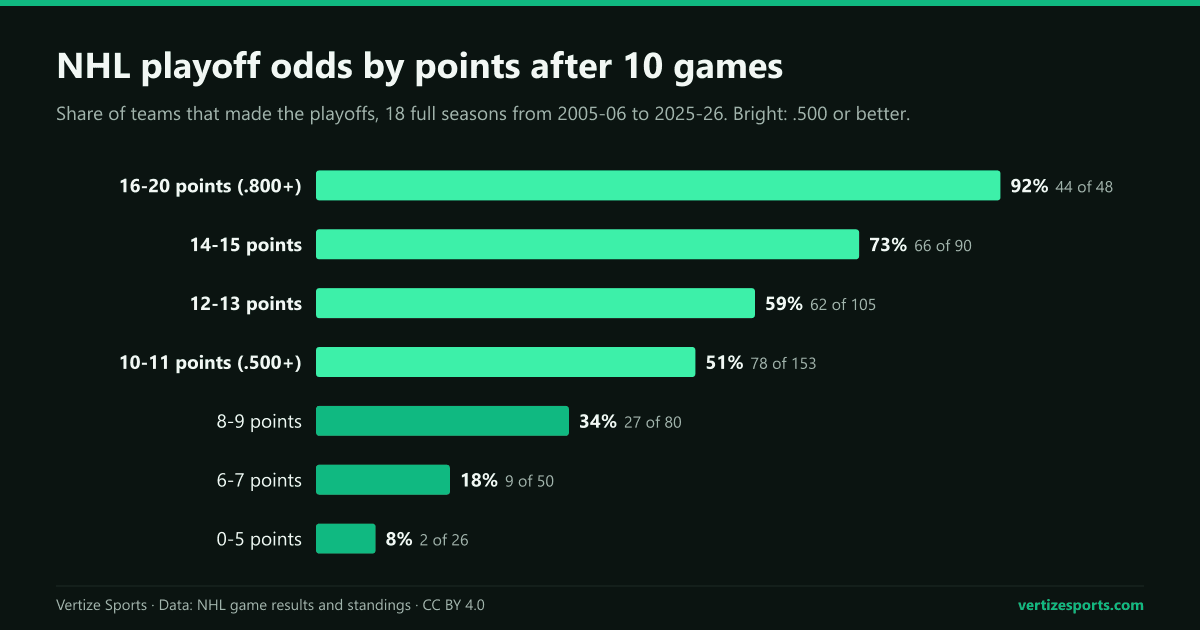
NHL playoff odds by points after 10 games
Ten games is about an eighth of the season, and the top of the table is already fairly reliable. Teams with 16 points or more after 10 games, a .800 points percentage, made the playoffs 44 times in 48, 92 percent. At the other end, 18 of 113 teams with 8 points or fewer got in, 16 percent.
| Points after 10 games | For example | Teams | Made playoffs | Avg. final points |
|---|---|---|---|---|
| 18-20 | 9-1-0 or better | 15 | 14 (93%) | 109 |
| 17 | 8-1-1 | 8 | 7 (88%) | 103 |
| 16 | 8-2-0 | 25 | 23 (92%) | 104 |
| 15 | 7-2-1 | 29 | 23 (79%) | 102 |
| 14 | 7-3-0 | 61 | 43 (70%) | 99 |
| 13 | 6-3-1 | 33 | 22 (67%) | 96 |
| 12 | 6-4-0 | 72 | 40 (56%) | 93 |
| 11 | 5-4-1 | 79 | 42 (53%) | 93 |
| 10 | 5-5-0 | 74 | 36 (49%) | 90 |
| 9 | 4-5-1 | 43 | 20 (47%) | 90 |
| 8 | 4-6-0 | 37 | 7 (19%) | 82 |
| 7 | 3-6-1 | 31 | 6 (19%) | 79 |
| 6 | 3-7-0 | 19 | 3 (16%) | 79 |
| 0-5 | 2-7-1 or worse | 26 | 2 (8%) | 70 |
The middle is close to a coin flip. Teams with exactly 10 points, a 5-5-0 start or its equivalent, made the playoffs 36 of 74 times, 49 percent, and finished with 90 points on average. Teams with 16 points finished with 104 on average and teams with 6 with 79: the 10-point gap after 10 games grew to about 25 by April, not the 82 that both paces kept up would have produced.
How many NHL playoff teams were in a playoff spot after 10 games
To test the standings rather than raw records, we built a 10-game table for every season: each team's first 10 games, ranked with that season's playoff format. Through 2011-12 that meant the three division leaders plus the next five in each conference; since 2013-14 it has been the top three in each division plus two wild cards per conference. Ties were broken by regulation wins, then regulation and overtime wins, wins and goal differential.
Of the 288 teams in a playoff spot in that table, 197 made the playoffs, 68 percent, or about 11 of 16 each season. The count ranged from 9 in 2009-10 to 13 in 2006-07 and 2022-23. By US Thanksgiving, when the same test gives 221 of 288, about four teams a season change places; after 10 games it is about five. The 10-game table did better than Thanksgiving only once, in 2006-07, and matched it three times.
| Season | 10th game played | In a spot after 10 games, made it | In a spot at Thanksgiving, made it |
|---|---|---|---|
| 2025-26 | Oct. 25-31 | 10 of 16 | 12 of 16 |
| 2024-25 | Oct. 24-Nov. 3 | 11 of 16 | 12 of 16 |
| 2023-24 | Oct. 30-Nov. 4 | 10 of 16 | 13 of 16 |
| 2022-23 | Oct. 27-Nov. 7 | 13 of 16 | 13 of 16 |
| 2021-22 | Oct. 31-Nov. 9 | 11 of 16 | 12 of 16 |
| 2018-19 | Oct. 23-Nov. 1 | 10 of 16 | 11 of 16 |
| 2017-18 | Oct. 23-31 | 11 of 16 | 11 of 16 |
| 2016-17 | Oct. 30-Nov. 5 | 12 of 16 | 13 of 16 |
| 2015-16 | Oct. 25-31 | 10 of 16 | 12 of 16 |
| 2014-15 | Oct. 25-Nov. 4 | 12 of 16 | 13 of 16 |
| 2013-14 | Oct. 19-29 | 11 of 16 | 13 of 16 |
| 2011-12 | Oct. 22-Nov. 3 | 10 of 16 | 12 of 16 |
| 2010-11 | Oct. 23-Nov. 5 | 11 of 16 | 12 of 16 |
| 2009-10 | Oct. 22-31 | 9 of 16 | 12 of 16 |
| 2008-09 | Oct. 24-Nov. 4 | 11 of 16 | 14 of 16 |
| 2007-08 | Oct. 20-Nov. 1 | 11 of 16 | 11 of 16 |
| 2006-07 | Oct. 23-Nov. 2 | 13 of 16 | 12 of 16 |
| 2005-06 | Oct. 22-30 | 11 of 16 | 13 of 16 |
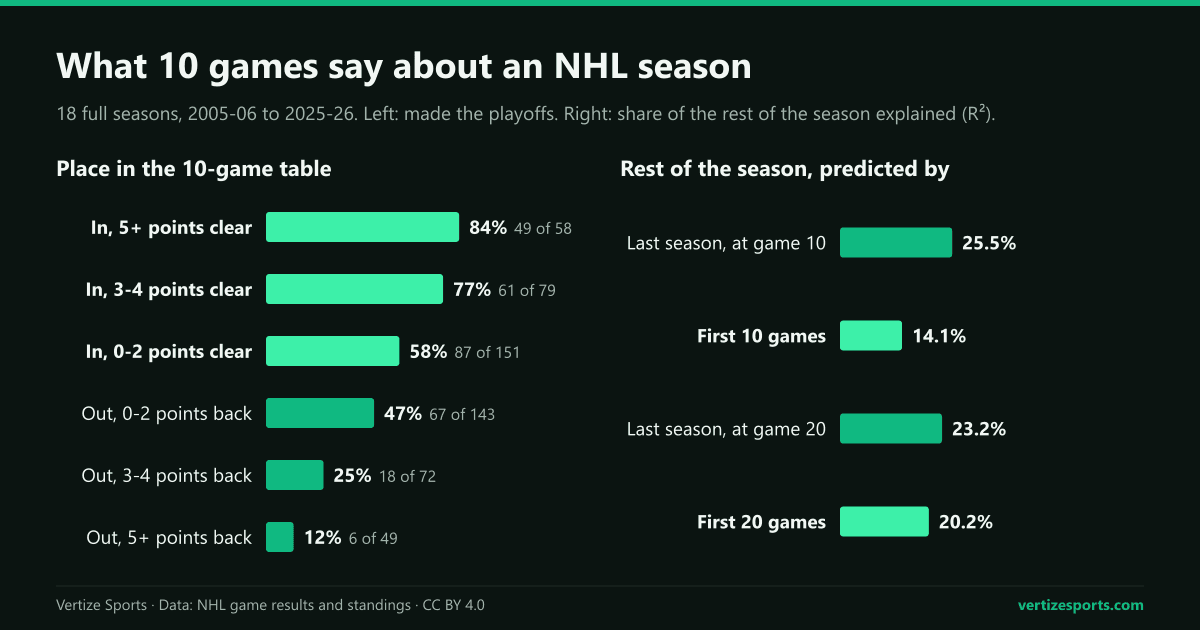
The margin matters more than the place. Teams five or more points inside the line after 10 games made the playoffs 49 times in 58, 84 percent, while teams inside by two points or fewer made it 58 percent of the time, barely more than the 47 percent of teams out by two or fewer. From five or more points back, 6 of 49 got in.
The seasons left out look similar: the 10-game table held 11 of 16 playoff teams in 2012-13 and 12 of 16 in 2020-21. In 2019-20, 10 of the 16 teams in place after 10 games reached the 16-team first round.
How much the first 10 games predict the rest of an NHL season
A team's points percentage after 10 games accounts for 32 percent of the differences between teams' final points percentages, a share statisticians call R². Part of that comes free: the 10 games are in the final record. Against the 72 games still to play, it explains 15 percent.
The share grows slowly: 8 percent after 5 games, 21 after 20 and 23 at the halfway mark of 41. Last season's points percentage does better early on. Across the 519 team-seasons with a previous season, it explained 25 percent of games 11 to 82, against 14 percent for the new 10-game record, and it was still ahead after 20 games, 23 to 20.
That is a sharp contrast with basketball, where an NBA team's first 20 games explain about half of the rest of its season.
Hot NHL starts that faded and slow starts that recovered
Only one team started 10-0-0 in the sample: the 2006-07 Buffalo Sabres, who won the Presidents' Trophy with 113 points and lost in the conference final. Some starts misled in both directions:
- Montreal Canadiens, 2015-16: 9-1-0 after 10 games and the only one of 22 teams that opened 5-0-0 to miss the playoffs. They finished 38-38-6 with 82 points.
- Vancouver Canucks, 2005-06: 8-1-1, then 42-32-8 and 92 points, out of the playoffs.
- Anaheim Ducks, 2015-16: 1-7-2 after 10 games, the worst start of any playoff team in the sample. They won the Pacific Division with 103 points.
- Edmonton Oilers, 2023-24: 2-7-1, then 104 points and a place in the Stanley Cup Final.
- Three more teams reached the Final after a 10-game record well under .500: the 2005-06 Oilers (3-6-1), the 2013-14 New York Rangers (3-7-0) and the 2016-17 Nashville Predators (3-5-2).
Stanley Cup champions and the NHL standings after 10 games
Of the 18 Stanley Cup champions in the sample, 14 were in a playoff spot in the 10-game table. The four that were not: the 2017-18 Washington Capitals (4-5-1), the 2018-19 St. Louis Blues (3-4-3), the 2021-22 Colorado Avalanche (4-5-1) and the 2023-24 Florida Panthers (5-4-1). The Capitals, Blues and Avalanche had 9 points each, the fewest of any champion after 10 games.
The regular season's best teams were usually visible early: 16 of the 18 Presidents' Trophy winners were in a playoff spot after 10 games. The exceptions were the 2011-12 Vancouver Canucks, 4-5-1, and the 2014-15 New York Rangers, 5-4-1. How those winners fared in the playoffs is told in how often the Presidents' Trophy winner wins the Stanley Cup.
Where the 2026-27 NHL standings stand after the first week
The 2026-27 season began on Tuesday, September 29, and on the NHL's schedule every team plays 84 games. Through the games of Wednesday, October 7, 55 games had been played and no team had reached 10: one had played five, 13 had played four, 17 three and one two. That is too few games for the numbers above to apply.
On the official standings after those games, the New York Rangers led the league at 4-1-0 with 8 points, ahead of the Edmonton Oilers and Winnipeg Jets with 7. Three teams had yet to win: the Calgary Flames (0-3-0), the Los Angeles Kings (0-2-1) and the Philadelphia Flyers (0-2-2). After five games, only the extremes have counted: 21 of the 22 teams that opened 5-0-0 made the playoffs and none of the 14 with one point or fewer did, but across all teams a five-game record explained just 8 percent of the rest of the season.
Each team's 10th game fell between Saturday, October 17 and Tuesday, October 27 on the schedule, 30 of the 32 by October 24. Our NHL standings follow the race game by game, and the NHL simulator plays out the rest of the season from the real standings, with every finished game locked. The next checkpoint after that is US Thanksgiving, Thursday, November 26.
NHL first 10 games: frequently asked questions
Does a hot start matter in the NHL? It helps: 92 percent of teams with 16 or more points after 10 games made the playoffs since 2005-06. But the 10-game record explains only about 15 percent of the rest of a season, less than last season's record.
How many NHL teams in a playoff spot after 10 games make the playoffs? About 11 of 16 a season: 197 of 288 since 2005-06, 68 percent, against 221 of 288 for teams in a playoff spot on US Thanksgiving.
Can an NHL team with a bad start make the playoffs? Yes, but rarely from very far back: 18 of 113 teams with 8 points or fewer after 10 games did. The 2015-16 Anaheim Ducks were 1-7-2 and won their division.
Do NHL teams that start 5-0 make the playoffs? Almost always: 21 of 22 since 2005-06. The exception was the 2015-16 Montreal Canadiens, who were 9-1-0 after 10 games and finished 38-38-6.
How this was built: every regular-season game from 2005-06 to 2025-26 from the NHL's stats API, in date order per team; every final record matches the NHL's final standings, apart from one overtime loss Minnesota is not credited with in 2023-24, after its 20th game, where the official standings are used. Playoff teams have a clinch mark in the final standings, matched against the playoff series. The 10-game table uses each team's first 10 games, that season's divisions and format, and these tiebreakers: points, regulation wins, regulation and overtime wins, wins, goal differential without shootouts, goals. Shares explained are R² from linear regressions on points percentage. Last season is matched by franchise, which leaves out 2005-06, after the canceled 2004-05 season, and the first seasons of Vegas, Seattle and Utah. The 2026-27 schedule and standings were retrieved from the NHL on October 8, 2026.